> ## Documentation Index
> Fetch the complete documentation index at: https://docs.trymeridian.com/llms.txt
> Use this file to discover all available pages before exploring further.
# Referrals
> Track click-through sessions (and optional revenue) from AI platforms via your Google Analytics integration.
Referrals shows **click-through traffic from AI platforms** (ChatGPT, Perplexity, Copilot, Grok, etc.) as measured in your connected **Google Analytics (GA4)** property.
 This is useful for two main reasons:
1. It gives you a **directional trend** of whether AI-driven discovery is increasing over time (especially after you publish content, earn citations, or improve rankings).
2. If you have ecommerce revenue tracked in GA, it can show **revenue from AI-referred sessions** (also directional).
Referrals is best used as a **trend monitor**, not as a complete ROI number. It only counts users who click directly from an AI platform to your site (and, for revenue, only those who convert within the tracked session).
## Setup: link your Google Analytics property
Referrals uses your Google Analytics integration. If you haven’t selected a property yet, you’ll see an empty state prompting you to link/select one.
1. Go to **Website → Referrals**
2. Click **Select property**
3. Choose the GA4 property you want Meridian to use
Once linked, Meridian will start showing AI-platform sessions and (if available) revenue.
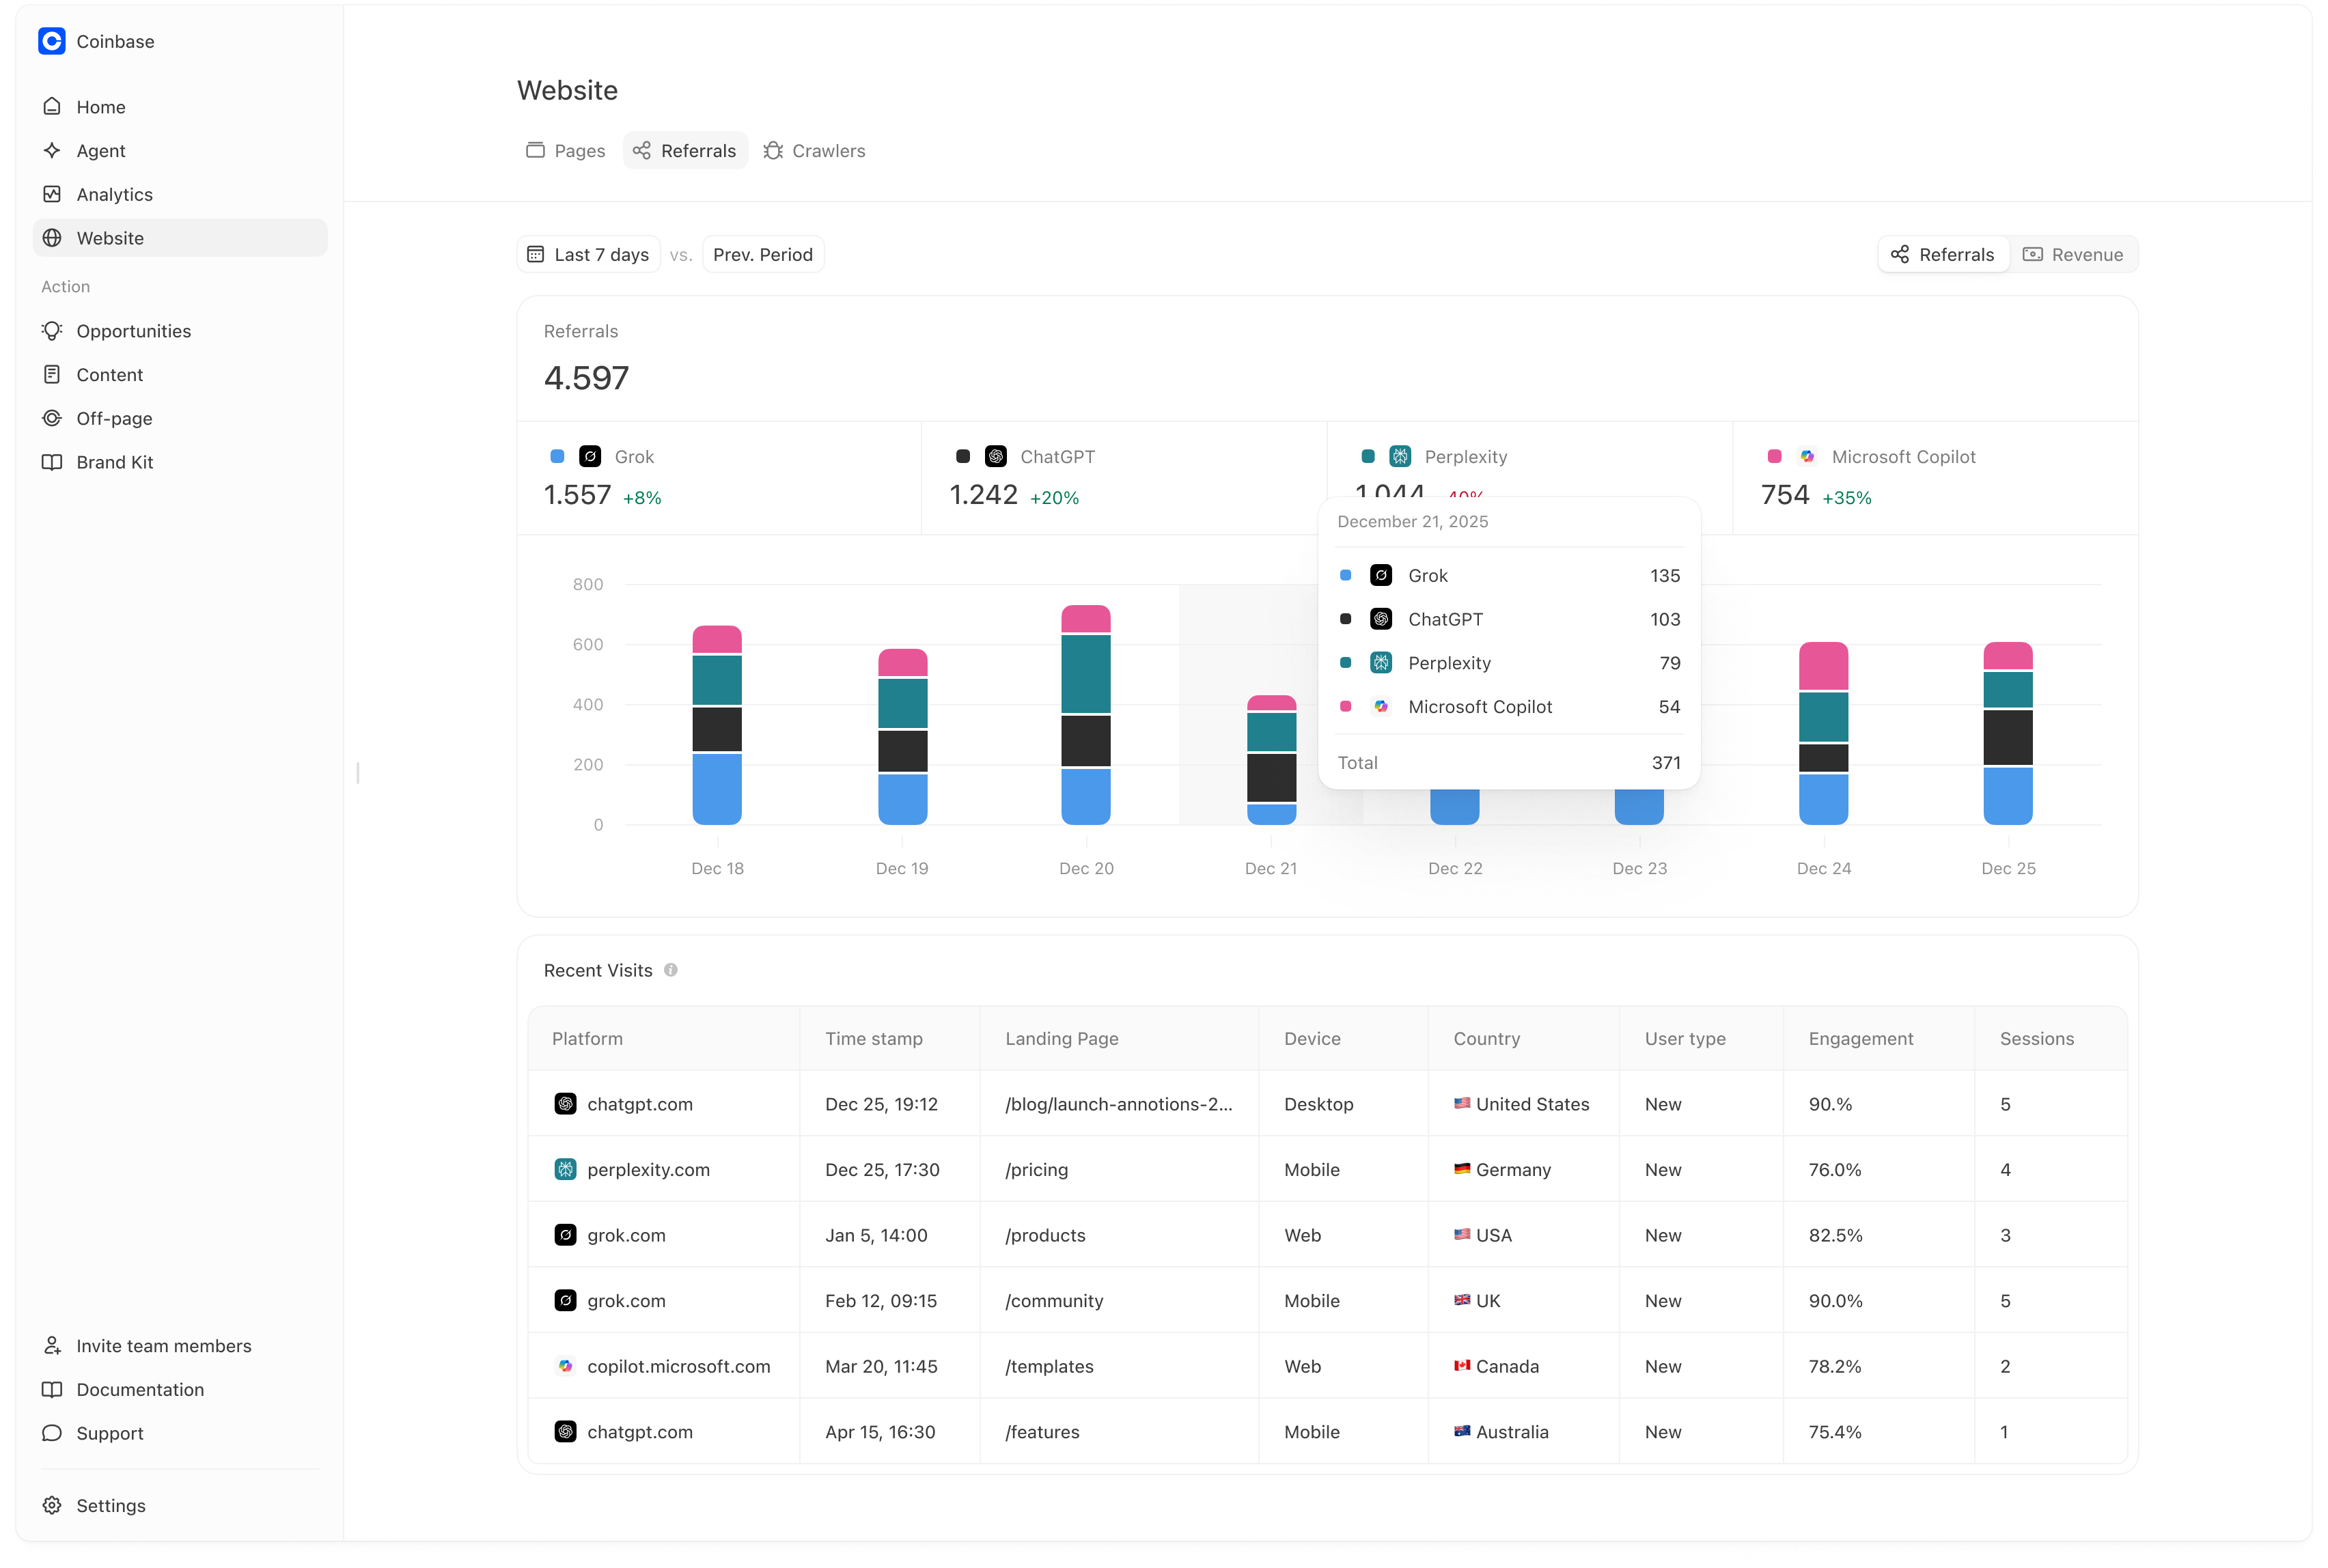
## Referrals view (click-through sessions)
The **Referrals** view shows sessions where GA attributes the session source to an AI platform domain (e.g., ChatGPT, Perplexity, CoPilot, etc.).
### What you see
* **Total referrals** for the selected time range
* **Breakdown by platform** (ChatGPT, Perplexity, Copilot, Grok, etc.) with period-over-period deltas
* A **trend chart** so you can see changes over time
* **Recent Visits**, including landing page, device, country, and engagement (helpful for debugging and optimization)
### How teams use this
* Identify which AI platforms are driving the most click-through traffic.
* Identify the **landing pages** AI users hit most often, then improve those pages (clear value prop, FAQs, comparison criteria, internal linking).
* Use week-over-week changes to validate whether your AI visibility work is translating into more inbound sessions.
### Practical example
If you publish a “Best basketball shoes” guide and then see:
* more ChatGPT referrals over the next week,
* and more sessions landing on that guide URL,
that is a strong directional signal the work is paying off.
## Important nuance: this undercounts AI influence
Referrals is **click-through tracking**, not “total influence.”
It only counts sessions where someone:
1. Sees a recommendation in an AI platform, and then
2. Clicks through to your site in that moment (so GA records the referrer domain like `chatgpt.com` or `perplexity.ai`).
A lot of AI-influenced journeys will not show up here, for example:
* The user gets a recommendation in AI, then Google searches your brand and clicks a search result.
* The user reads the AI answer, leaves, and comes back later via direct, a bookmark, or another device.
* The user shares your brand with someone else, who then visits via a different channel.
### How big is the gap (roughly)?
Public research strongly suggests direct clicks are a small fraction of “people who saw an AI answer.”
**Practical takeaway:** It is normal for GA to capture only a small fraction of AI exposure. Use Referrals to monitor directional trend (up/down by platform and by landing page), not as a complete ROI number.
A helpful mental model: “Referrals = minimum measurable click-through.”
It is a lower bound on AI impact, because it only counts immediate clicks that preserve the AI referrer.
## Revenue view (optional)
If your GA4 property tracks revenue and ecommerce events, you can switch to the **Revenue** view.
This is useful for two main reasons:
1. It gives you a **directional trend** of whether AI-driven discovery is increasing over time (especially after you publish content, earn citations, or improve rankings).
2. If you have ecommerce revenue tracked in GA, it can show **revenue from AI-referred sessions** (also directional).
Referrals is best used as a **trend monitor**, not as a complete ROI number. It only counts users who click directly from an AI platform to your site (and, for revenue, only those who convert within the tracked session).
## Setup: link your Google Analytics property
Referrals uses your Google Analytics integration. If you haven’t selected a property yet, you’ll see an empty state prompting you to link/select one.
1. Go to **Website → Referrals**
2. Click **Select property**
3. Choose the GA4 property you want Meridian to use
Once linked, Meridian will start showing AI-platform sessions and (if available) revenue.
## Referrals view (click-through sessions)
The **Referrals** view shows sessions where GA attributes the session source to an AI platform domain (e.g., ChatGPT, Perplexity, CoPilot, etc.).
### What you see
* **Total referrals** for the selected time range
* **Breakdown by platform** (ChatGPT, Perplexity, Copilot, Grok, etc.) with period-over-period deltas
* A **trend chart** so you can see changes over time
* **Recent Visits**, including landing page, device, country, and engagement (helpful for debugging and optimization)
### How teams use this
* Identify which AI platforms are driving the most click-through traffic.
* Identify the **landing pages** AI users hit most often, then improve those pages (clear value prop, FAQs, comparison criteria, internal linking).
* Use week-over-week changes to validate whether your AI visibility work is translating into more inbound sessions.
### Practical example
If you publish a “Best basketball shoes” guide and then see:
* more ChatGPT referrals over the next week,
* and more sessions landing on that guide URL,
that is a strong directional signal the work is paying off.
## Important nuance: this undercounts AI influence
Referrals is **click-through tracking**, not “total influence.”
It only counts sessions where someone:
1. Sees a recommendation in an AI platform, and then
2. Clicks through to your site in that moment (so GA records the referrer domain like `chatgpt.com` or `perplexity.ai`).
A lot of AI-influenced journeys will not show up here, for example:
* The user gets a recommendation in AI, then Google searches your brand and clicks a search result.
* The user reads the AI answer, leaves, and comes back later via direct, a bookmark, or another device.
* The user shares your brand with someone else, who then visits via a different channel.
### How big is the gap (roughly)?
Public research strongly suggests direct clicks are a small fraction of “people who saw an AI answer.”
**Practical takeaway:** It is normal for GA to capture only a small fraction of AI exposure. Use Referrals to monitor directional trend (up/down by platform and by landing page), not as a complete ROI number.
A helpful mental model: “Referrals = minimum measurable click-through.”
It is a lower bound on AI impact, because it only counts immediate clicks that preserve the AI referrer.
## Revenue view (optional)
If your GA4 property tracks revenue and ecommerce events, you can switch to the **Revenue** view.
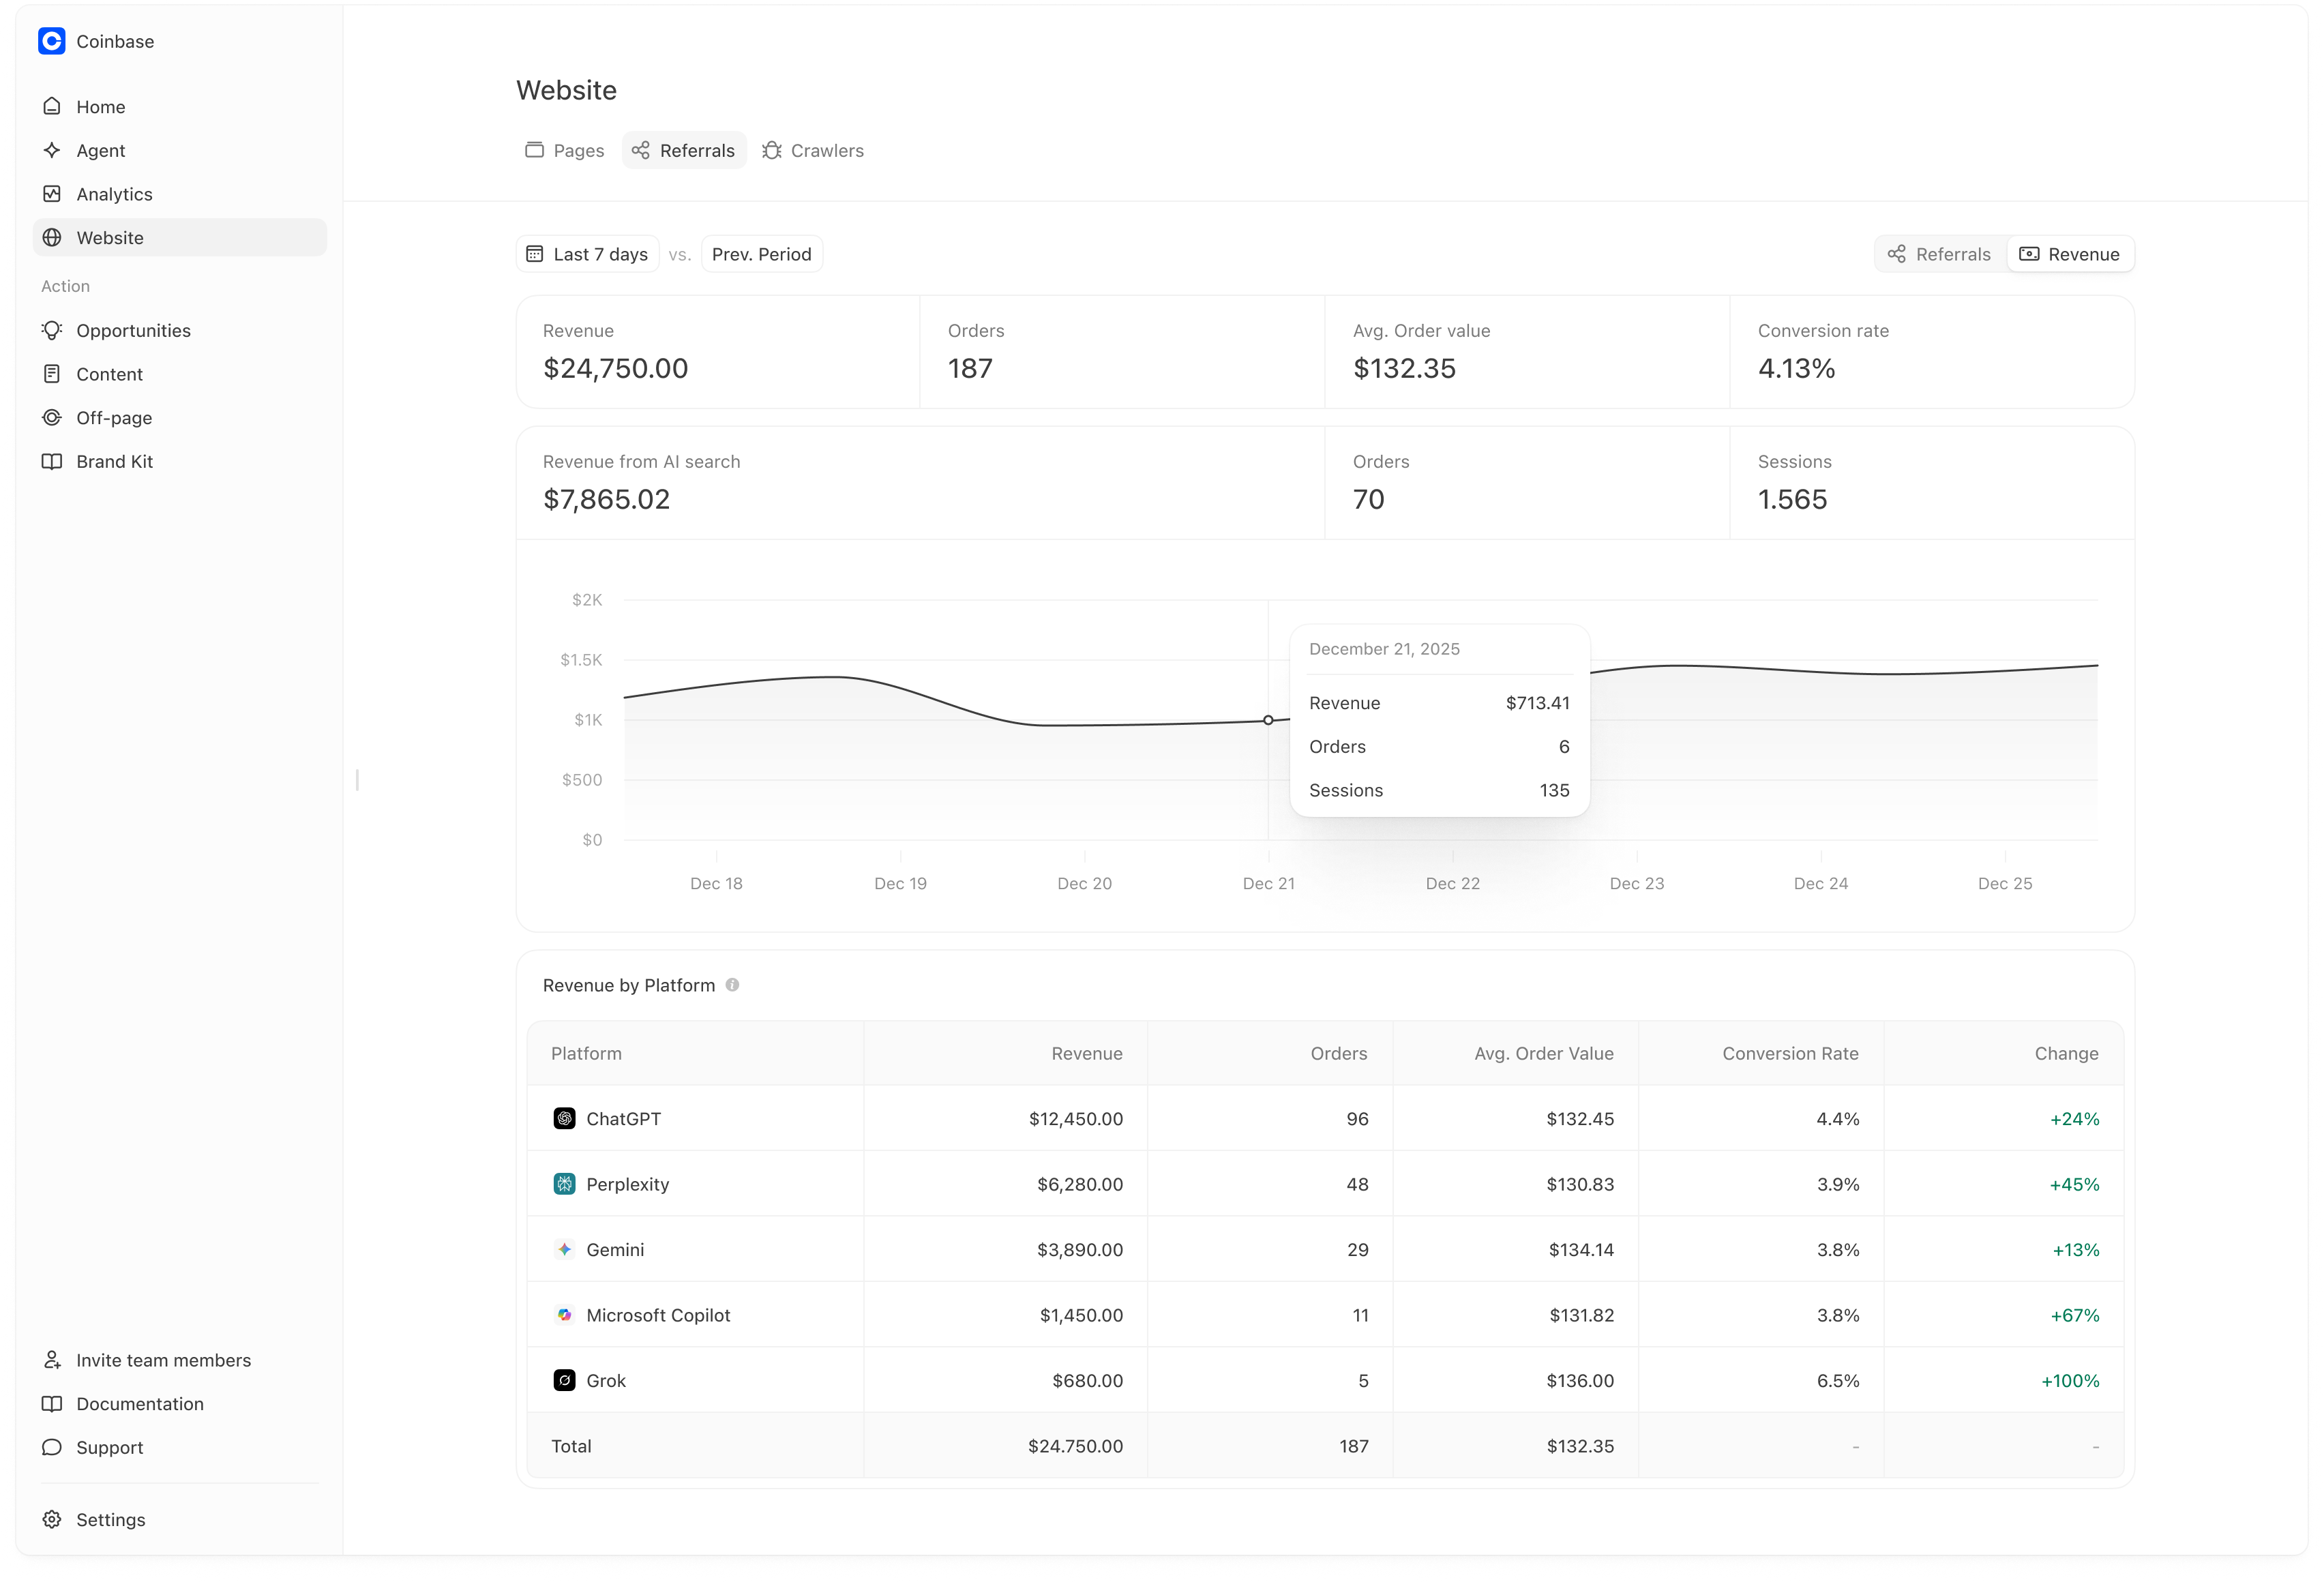 ### What you see
* Total **Revenue**, **Orders**, **AOV**, and **Conversion Rate** for the selected period
* **Revenue from AI search** (revenue attributed to sessions referred from AI platforms)
* A trend chart and **Revenue by Platform** table (which platforms are driving the tracked revenue)
### When this is most useful
* You want directional evidence that AI referrals are not just visits, but also producing conversions.
* You want to compare which platforms drive higher conversion rates or AOV.
This “AI revenue” is a **lower bound**. It captures only conversions that happen in the measured click-through session (or attribution window configured in GA), and it will miss many “view-through” journeys where AI influenced the buyer but GA credits another channel later.
### What you see
* Total **Revenue**, **Orders**, **AOV**, and **Conversion Rate** for the selected period
* **Revenue from AI search** (revenue attributed to sessions referred from AI platforms)
* A trend chart and **Revenue by Platform** table (which platforms are driving the tracked revenue)
### When this is most useful
* You want directional evidence that AI referrals are not just visits, but also producing conversions.
* You want to compare which platforms drive higher conversion rates or AOV.
This “AI revenue” is a **lower bound**. It captures only conversions that happen in the measured click-through session (or attribution window configured in GA), and it will miss many “view-through” journeys where AI influenced the buyer but GA credits another channel later.